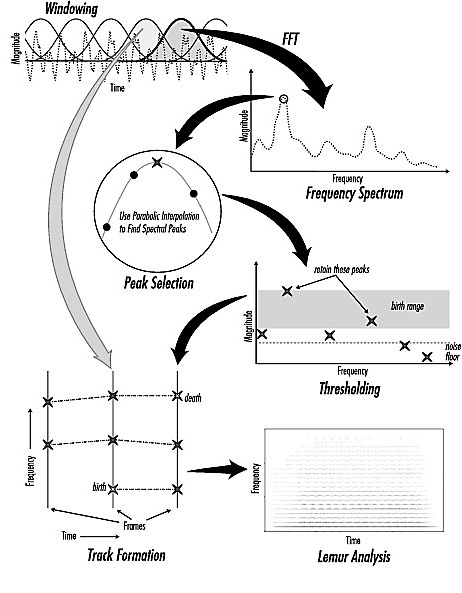
The Lemur Analysis Process
The figure below shows an overview of the Lemur analysis process. A frequency spectrum is
computed for a windowed block of samples from the signal to be
analyzed. The spectrum is searched
for peaks, and the peaks which meet the thresholding criteria are retained to make analysis frames. Peaks
in succesive frames are linked to form tracks. A track represents the time-varying behavior of a single
frequency components in the signal. The track data is stored as a Lemur analysis file.

Click here to download a
higher resolution (300 dpi) version of this picture.
Forward to Spectral Windowing
Up to Lemur Documentation Index
lemur@uiuc.edu

