Thresholding in Lemur Analysis
Lemur locates spectral peaks corresponding to significant sinusoidal components in the analzed signal using
parabolic interpolation between spectral samples (Maher 1989, Serra
1989). Once peaks have been selected from an analysis spectrum, some method is needed to determine
which are the most significant sinusoidal components in the signal. A Noise Floor is established by setting an
absolute amplitude threshold below which peaks are considered insignificant and are ignored. Additionally, a
Peak Amplitude Range relative to the largest (magnitude) peak in a frame is used (Maher 1989).
The largest peak in a frame is found, and peaks which fall outside of the specified amplitude range are assumed to
be masked by the louder peaks in the frame. In this way, low amplitude peaks which are inaudible during loud
portions of a sound are omitted, and during quieter portions of the sound, when they are more likely to be audible,
the low amplitude peaks are retained. The amplitude threshold for retaining peaks is taken to be the maximum of the
Spectrum Noise Floor and the relative Peak Amplitude Range. This threshold varies from frame to frame as the amplitude
and spectral characterof the analysis signal vary.
The Spectrum Noise Floor and Peak Amplitude Range for the Lemur analysis window may be set directly in the
Peak Selection Parameters panel, accessed from Lemur's Parameters menu.
Examples
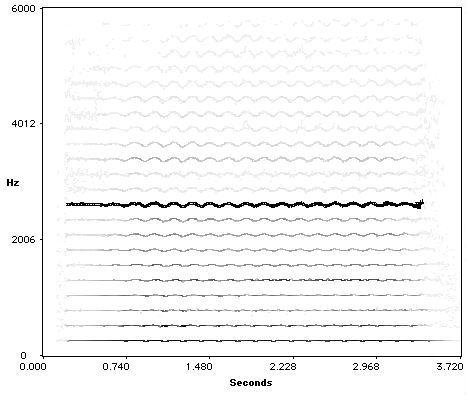
A violin tone at approximately 260 Hz analyzed with Noise Floor -90 dB and Peak Amplitude Range 28 dB:

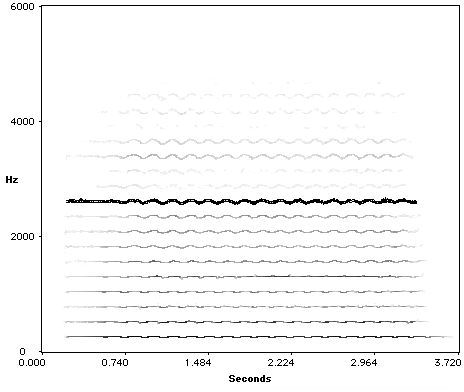
A violin tone at approximately 260 Hz analyzed with Noise Floor -60 dB and Peak Amplitude Range 28 dB:

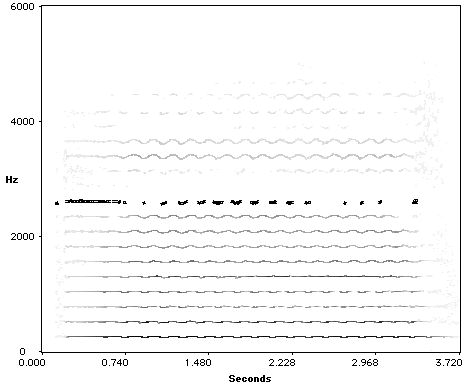
A violin tone at approximately 260 Hz analyzed with Noise Floor -90 dB and Peak Amplitude Range 12 dB:

(In each example, the track corresponding to the 10th harmonic has been highlighted.)
Forward to Lemur Track Formation
Back to Lemur Analysis Frame Length
Up to Lemur Documentation Index
lemur@uiuc.edu


